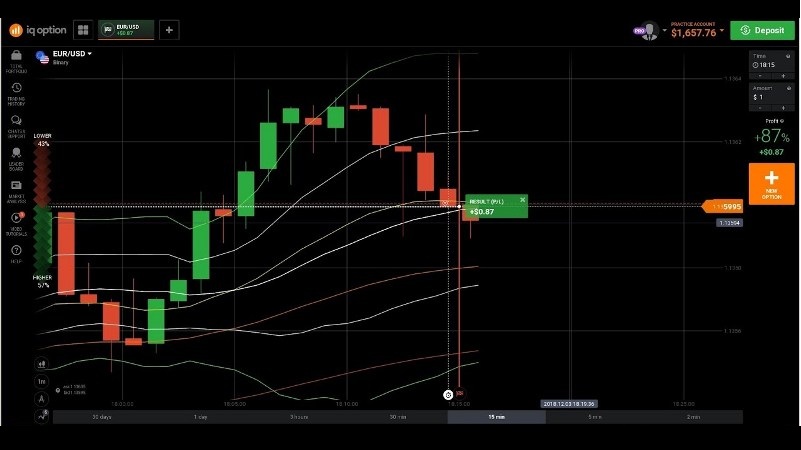
The principle behind technical analysis is that the price of an asset is correct at any one time. It will therefore change in line with events as they occur and market movements will always reflect those events.
Since technical analysis is based on the premise that price movements are logical, they are also predictable. As a result, most technical analysts study historical movements to predict how prices will change in the future. The reasoning is that, as responses to events are constant, future changes should follow past patterns.
Assumptions
The practice of technical analysis is in fact based on three assumptions:
- The market discounts everything that happens or that could affect the asset and so all factors are included in the price. This removes the need to consider a wide range of factors as for fundamental analysis.
- Prices always follow trends and so trading strategies can be based on identifying trends and determining their direction.
- History generally repeats itself because traders always react to the same events in the same way. Discovering how prices reacted to an event in the past therefore gives an indication of the type of reaction to expect now.
Methodologies
Technical analysis can use a number of different methodologies, as follows:
- trend following, which looks at moving averages over previous periods to identify upward and downward trends
- tracking momentum, otherwise known as moving average convergence divergence (MACD), which is used to track short-term and long-term averages to detect changes in momentum
- mean reversion that sets price movement direction by determining if it is moving back to its mean value
- pattern return establishes price movement patterns to predict future movements.
Price Charts
Most technical analysts study price charts for every asset that they plan to trade. These charts generally plot price movements over time, with the length of the time intervals that are set depending on whether undertaking short-term or long-term trades. Prices may also be tracked by volume when the volumes traded vary at different times (such as being heavy through the day and lighter at night).
The types of chart vary, with line charts that connect different prices by lines being the simplest and most popular. Bar charts and candlestick charts are sometimes used because they can show several prices during any given period — high, low, opening and closing price for the period, for example.
The whole purpose of studying price charts is to identify patterns. Based on the technical analysis assumption that history repeats itself, these patterns will indicate how prices are likely to move and are of two types:
- reversal patterns that show a change of direction is due
- continuation patterns that indicate the price will continue to move in the same direction
There are a variety of patterns representing these different types and you need to recognize which they are in order to predict future price movements. However, some can appear similar but indicate a different trend type, so you need to identify them accurately otherwise your binary options trades will be in completely the wrong direction.
Reversal Patterns
- A wedge indicates a price will start to move in the opposite direction to the trend formed within the wedge. This is established when two trend lines converge to form a falling or rising wedge. The upper trend line provides resistance while the lower one forms support, with the price moving within them.
- A diamond has the shape of a diamond lying on its side. It may be a diamond top where a series of waves become lower below a trend’s peak or a diamond bottom where the waves gradually flatten at the bottom of a down trend. A breakout in the opposite direction is due when the waves approach the top or bottom one.
Continuation Patterns
- A flag will slope in the opposite direction to the trend but indicate a continuation of the trend. The price will tend to stay within two parallel trend lines. If the price breaks through the upper resistance level, the trend continues upward whereas a break through the lower support line indicates a continuing down trend.
- A pennant differs to a flag because the trend lines converge rather than being parallel. This is generally due to slow trading activity causing the price channel to become narrower although the trend will then continue as before once the volumes pick up.
- A triangle pattern consists of a series of waves that ascend above a base level or descend below it, always returning to the same base level. Ascending triangles have higher troughs but level tops while descending triangles have peaks that become higher but level troughs.
- A rectangle is formed when prices flatten out, usually during a period of consolidation in the middle of a trend. Once the consolidation period ends, the trend will continue in its previous direction.
Popular Topics: Copywriting > www.rccontemporary.com > https://www.grahakcunningham.com

